Workshop 05 - nD Images
← Home →Implementing a CT slice viewer
The Computed Tomography (CT) DICOM files contain both data => Hounsfield Units (HU) matrices, and metadata => information on patients, CT scanner used, etc. The HU scale represents a linear transformation of the X-Rays attenuation coefficient μ. Thus, distilled water at standard pressure and temperature (STP) is defined as 0 HU, while the radiodensity of air at STP is defined as -1000 HU.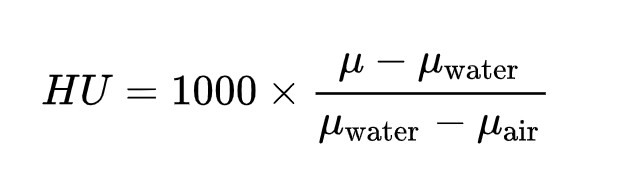
| Substance | HU |
|---|---|
| Air | -1000 |
| Fat | -120 to -90 |
| Bone | 300 to 1900 |
| Blod | 13 to 50 |
| Water | 0 |
| Lung | -700 to -600 |
| Kidney | 20 to 45 |
| Liver | 60 ± 6 |
| Muscle | 35 to 55 |
| White matter | 20 to 30 |
| Gray matter | 37 to 45 |
| Windowpane glass | 500 |
| Limestone (Calcar) | 2800 |
| Cooper | 14000 |
One could use the previously created Matrix class for loading a CT slice stored as a csv file: CT Slice csv example file
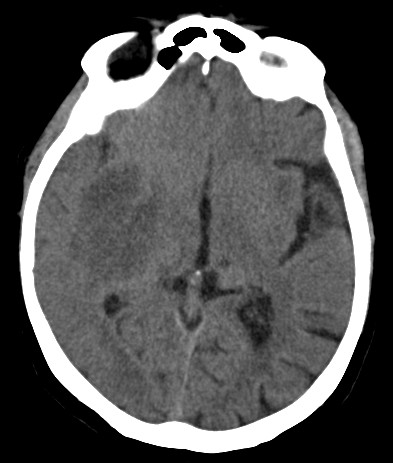
For viewing CT slices, one needs to transform it into a grayscale Bitmap image. The first step is applying a linear transformation, as bitmaps are limited to 256 values.
The next step is generating a Bitmap (see the below ToBitmap extension):
For viewing the image, one could now assign the bitmap object to the Image property of a PictureBox Win Forms control:
Try generating the bitmap for various HU windows.
It is important to note the difficulties in viewing/understanding the whole information contained in one HU matrix.
For storing 3D data, CTs are composed of various slice series (native, arterial contrast, venous contrast).
Multi-dimensional images
For storing a set of multi-dimensional points (e.g. Hyperspectral Images) one could use a csv file with a different structure: one column for each nD coordinate. In a Fuzzy approach, an additional column could be considered for storing the Degree of Membership of each nD point.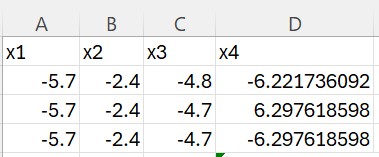
Find below a nD vector implementation:
Thus, an nD image could be represented as a generic list of NVector elements.
Consider also the corresponding data access implementation:
For viewing a 2D projection of the nD image, one could consider the following method:
nD Exercises:
Generate the coordinates of a Circle:
Generate the coordinates of a Sphere and test the result by viewing various 2D projections:
Generate the coordinates of a 4D HyperSphere and test the result by viewing various 2D projections:
References:
Application for estimating the fuzzy fractal dimension of hyperspectral satellite ocean color imagesOptimization technique for increasing resolution in computed tomography imaging
.Net WPF module for RGB 3D reconstruction of medical three-channel images
← Home →